Zimbabwe Crop Atlas: crop monitoring through the cloud season
On this page
In short
- WhatFollowing a maize season through its cloudiest months.
- HowSentinel-2, Landsat 8 and 9 and Sentinel-1, composited per pixel.
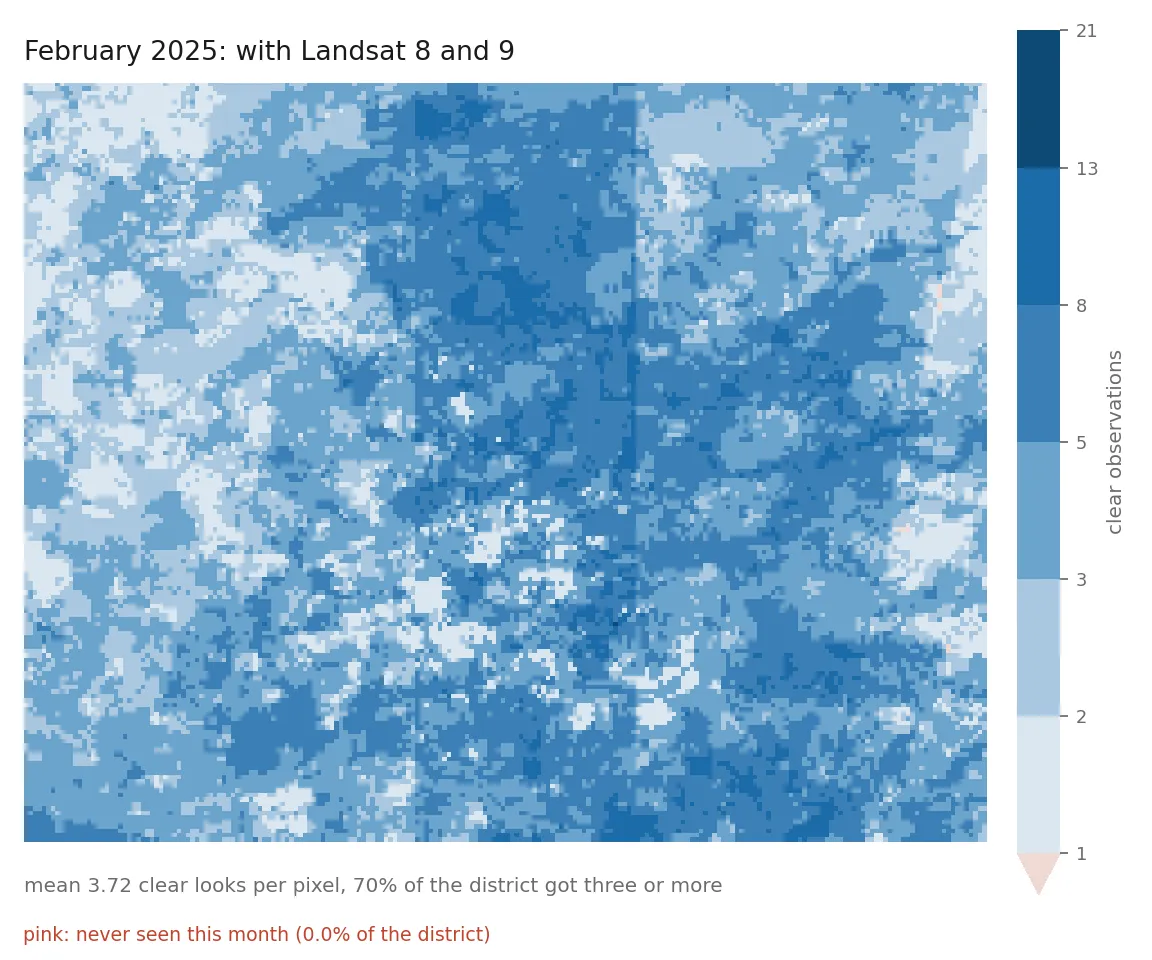
- ResultWith Landsat added, no part of the district went unseen in February 2025.
The question
Can free satellite archives follow a Zimbabwean growing season through the months that decide the maize yield? Those are the cloudiest months, and the answer depends on what the archive actually holds.
What it measures, and what it refuses to
The pipeline reads Sentinel-2, Landsat 8, Landsat 9 and Sentinel-1 from Digital Earth Africa, puts the optical sensors on one radiometric basis, composites them per pixel rather than per scene, and extracts season metrics. Every number travels with its evidence: which instruments contributed, how many clear looks each pixel got, and how much of the district was never seen.
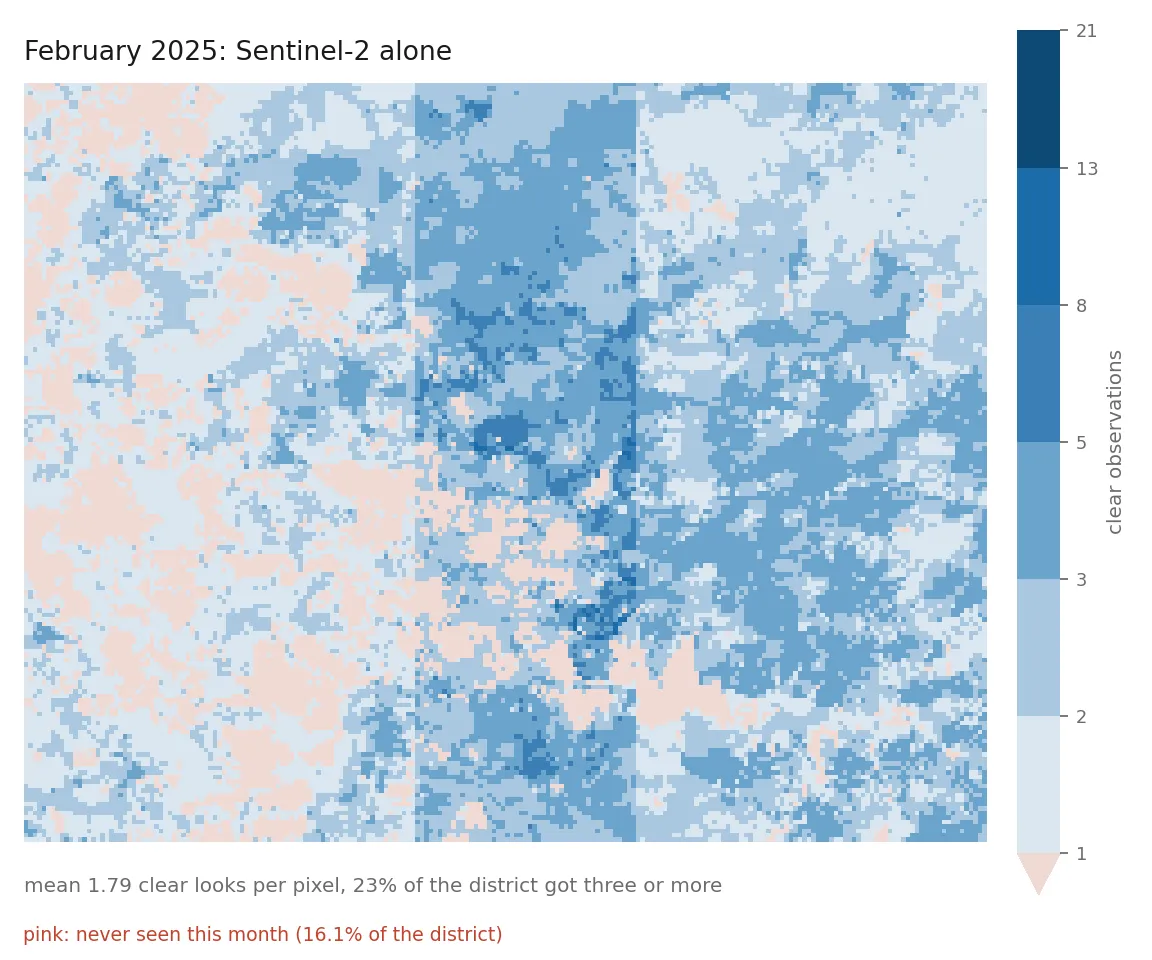
It refuses to report a district statistic computed from fewer than 60 percent of its pixels. February cloud sits on the high ground, so a mean over the visible pixels is biased with a known sign. A blank cell that says why is worth more than a plausible number nobody can audit.
Design decisions
Sensors, calibration and phenology are each measured from the data, not assumed.
Technical detail
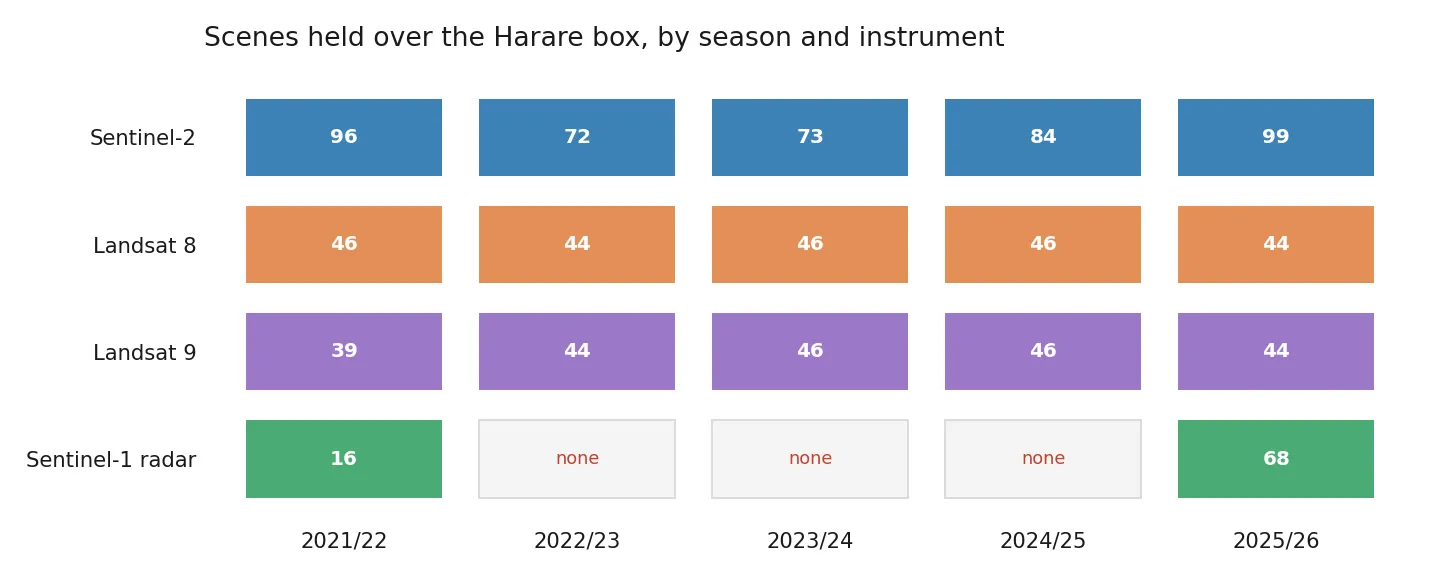
- Sensors are discovered, not declared. I planned to use Sentinel-1 radar, which sees through cloud. Digital Earth Africa holds no Sentinel-1 over the Zimbabwean maize belt for the 2022/23, 2023/24 or 2024/25 seasons, and two other archives agree that nothing was acquired. From November 2025 the same box has 17 radar acquisition days, from Sentinel-1C and Sentinel-1D. A hardcoded sensor list would be silently wrong for part of the archive, so each sensor declares what it holds and every output names the instruments behind it.
- Calibration is measured, not cited. Cross-sensor coefficients are fitted with Deming regression from coincident acquisitions over the study area. Bands below an r-squared floor of 0.70 are left uncorrected; on this data that refuses blue for both Landsat sensors.
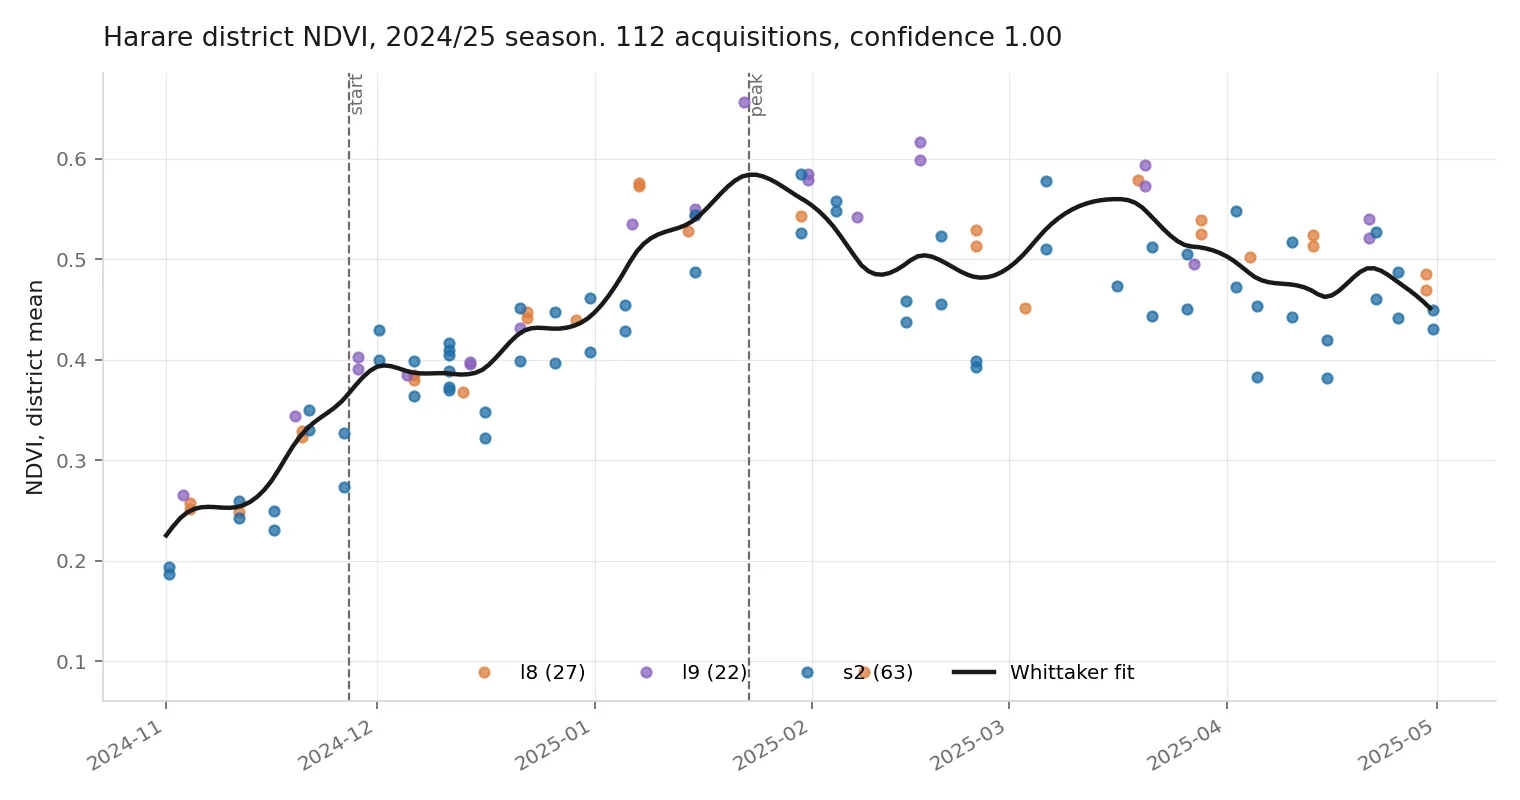
- Phenology is fitted on acquisitions, not composites. Fitting on monthly composites moved the measured peak by four days and dropped confidence from 1.00 to 0.19.
What it has found so far
Harare and Goromonzi, 0.40 by 0.30 degrees, at 200 m. Mean clear looks per pixel, 2024/25 season:
| month | S2 alone | with L8 and L9 | blind on S2 | blind on all |
|---|---|---|---|---|
| Nov 2024 | 4.03 | 9.45 | 0.0% | 0.0% |
| Dec 2024 | 8.75 | 16.17 | 0.0% | 0.0% |
| Jan 2025 | 3.08 | 6.80 | 0.2% | 0.0% |
| Feb 2025 | 1.79 | 3.72 | 16.1% | 0.0% |
| Mar 2025 | 2.13 | 5.46 | 9.3% | 0.3% |
| Apr 2025 | 7.30 | 11.18 | 0.0% | 0.0% |
In 2025/26, radar coverage is flat at 0.1 percent unseen in every month, including a January when the combined optical record still lost 6.1 percent of the district. Optical coverage is weather; radar coverage is orbital mechanics. There is no crop mask yet, so district numbers cover all land, including urban Harare.
Stack
Technical detail
Python, STAC search and windowed Cloud Optimized GeoTIFF reads with rasterio, Deming regression for calibration, a Whittaker smoother for phenology, and 167 tests with no network.
Links
Want to talk about this work? Email me or download my CV.