Grid Atlas: electricity availability from night-time satellite imagery
On this page
In short
- WhatIs this city darker than it normally is?
- HowVIIRS night-time imagery, each city against its own lit footprint.
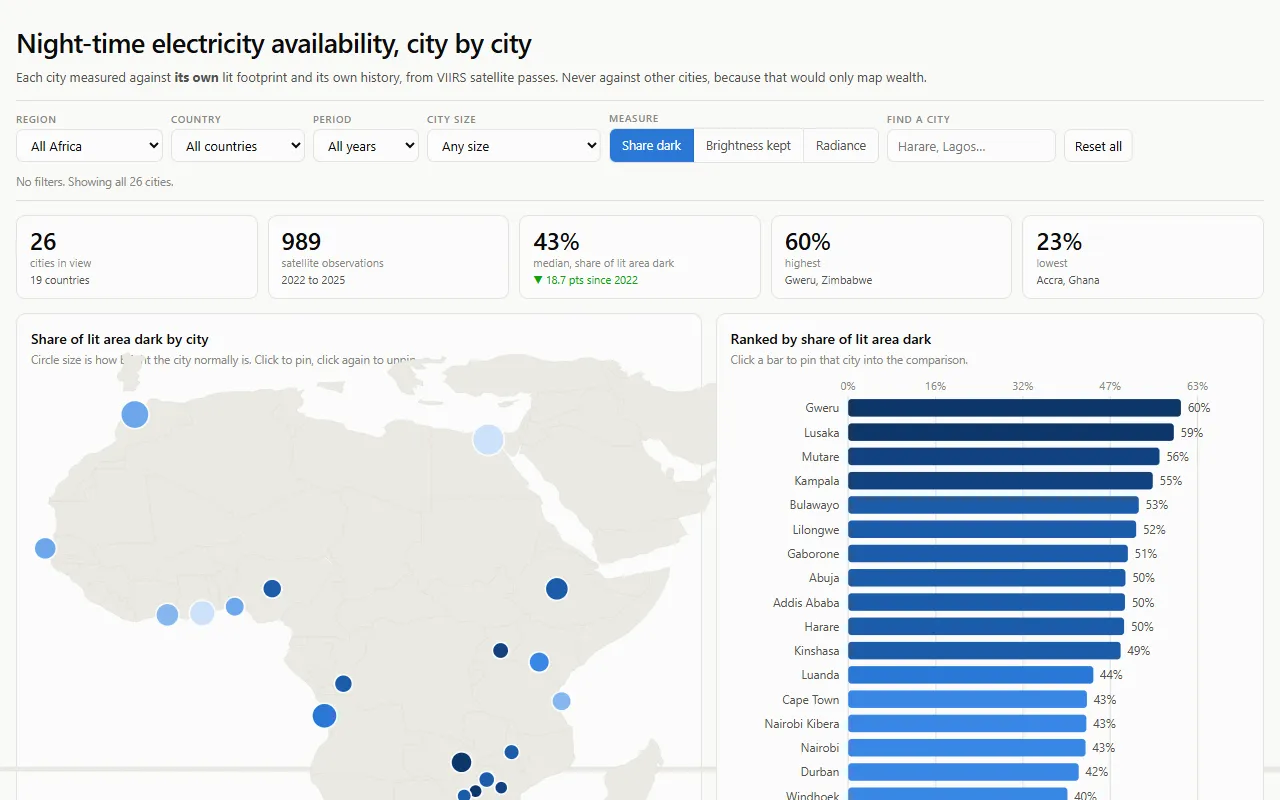
- Result26 African cities in a public preview dashboard, collection ongoing.
The question
Where can you put a factory, a cold store, a data centre or a base station and know what the power will actually do? Anyone placing capital in Africa has to price electricity availability, and there is no comparable, open series to price it from. So siting decisions get made on anecdote or a guessed diesel line.
The VIIRS Day-Night Band has imaged Africa every night since January 2012, at 500 m, with one instrument and one calibration. It is the only record that is consistent across every African market, and it is free.
What it measures, and what it refuses to
Every city is compared with its own history, never with another city. A map coloured by absolute brightness is a map of population and wealth. The question here is narrower: is this place darker than it normally is?
The unit is each city’s own lit footprint. Each pixel’s normal level is its 90th percentile across all observations, and pixels that never light up are excluded. The headline number, dark_share, is the fraction of that footprint below half its own normal on a given night.
It makes no claim about cause, and it is not a scorecard for any utility or country. Thin cloud is not corrected for, and generators and rooftop solar dim less during an outage, which under-detects outages in richer areas. Both caveats travel with the data.
Design decisions
Three decisions keep the series honest: each city’s own footprint, a guard against shrinking data, and a pre-registered test it must pass.
Technical detail
- The footprint, not a box. My first version took the median of a fixed 0.3 degree box. Cape Town read 3.6 against Johannesburg’s 19.1, five times dimmer, which is obviously false: 27 percent of Cape Town’s box is ocean and mountain. Nothing looked broken. I now sample each city’s own lit footprint, and I sanity-check a new metric against a case where I already know the answer.
- A guard against shrinking. After a cache eviction the weekly job cut the series from 989 observations to 363, then 374, then 337, for three weeks, and every run looked successful. Aggregation now refuses to publish a file materially smaller than the one it replaces.
- A pre-registered gate. If
dark_sharecannot separate labelled South African load shedding nights at AUC 0.70 on held-out cities, the electricity reading is withdrawn publicly.
What it has found so far
Status: preview, not a finding. 26 cities, sampled at every new moon from 2022 onward, with collection ongoing.
Share of each city's own lit footprint below half its normal brightness, at new-moon observations from 1 January 2022 to 26 February 2025, for Lagos, Nairobi, Accra, Johannesburg, Lusaka, Cairo. Each panel has its own scale, so the panels show change within a city, not differences between cities.
Stack
Technical detail
Python, rasterio and NumPy reading Cloud Optimized GeoTIFFs over HTTP, scheduled collection on GitHub Actions, and a dashboard on GitHub Pages. Code under Apache 2.0, derived data under CC BY 4.0.
Links
Want to talk about this work? Email me or download my CV.