Mapping equity: the flood crossings an open map cannot see
On this page
In short
- WhatWhere open map data serves some communities worse than others.
- HowOfficial Texas low-water crossings checked against Overture roads.
- Result8,454 crossings, none marked as flooding; 216 areas cut off.
The question
Zindi’s Bias Bounty Mapping Equity Challenge asks where open map data serves some communities worse than others. The challenge scorecard compares highway lengths between open and official road data. My question was what that comparison cannot see.
What it measures, and what it refuses to
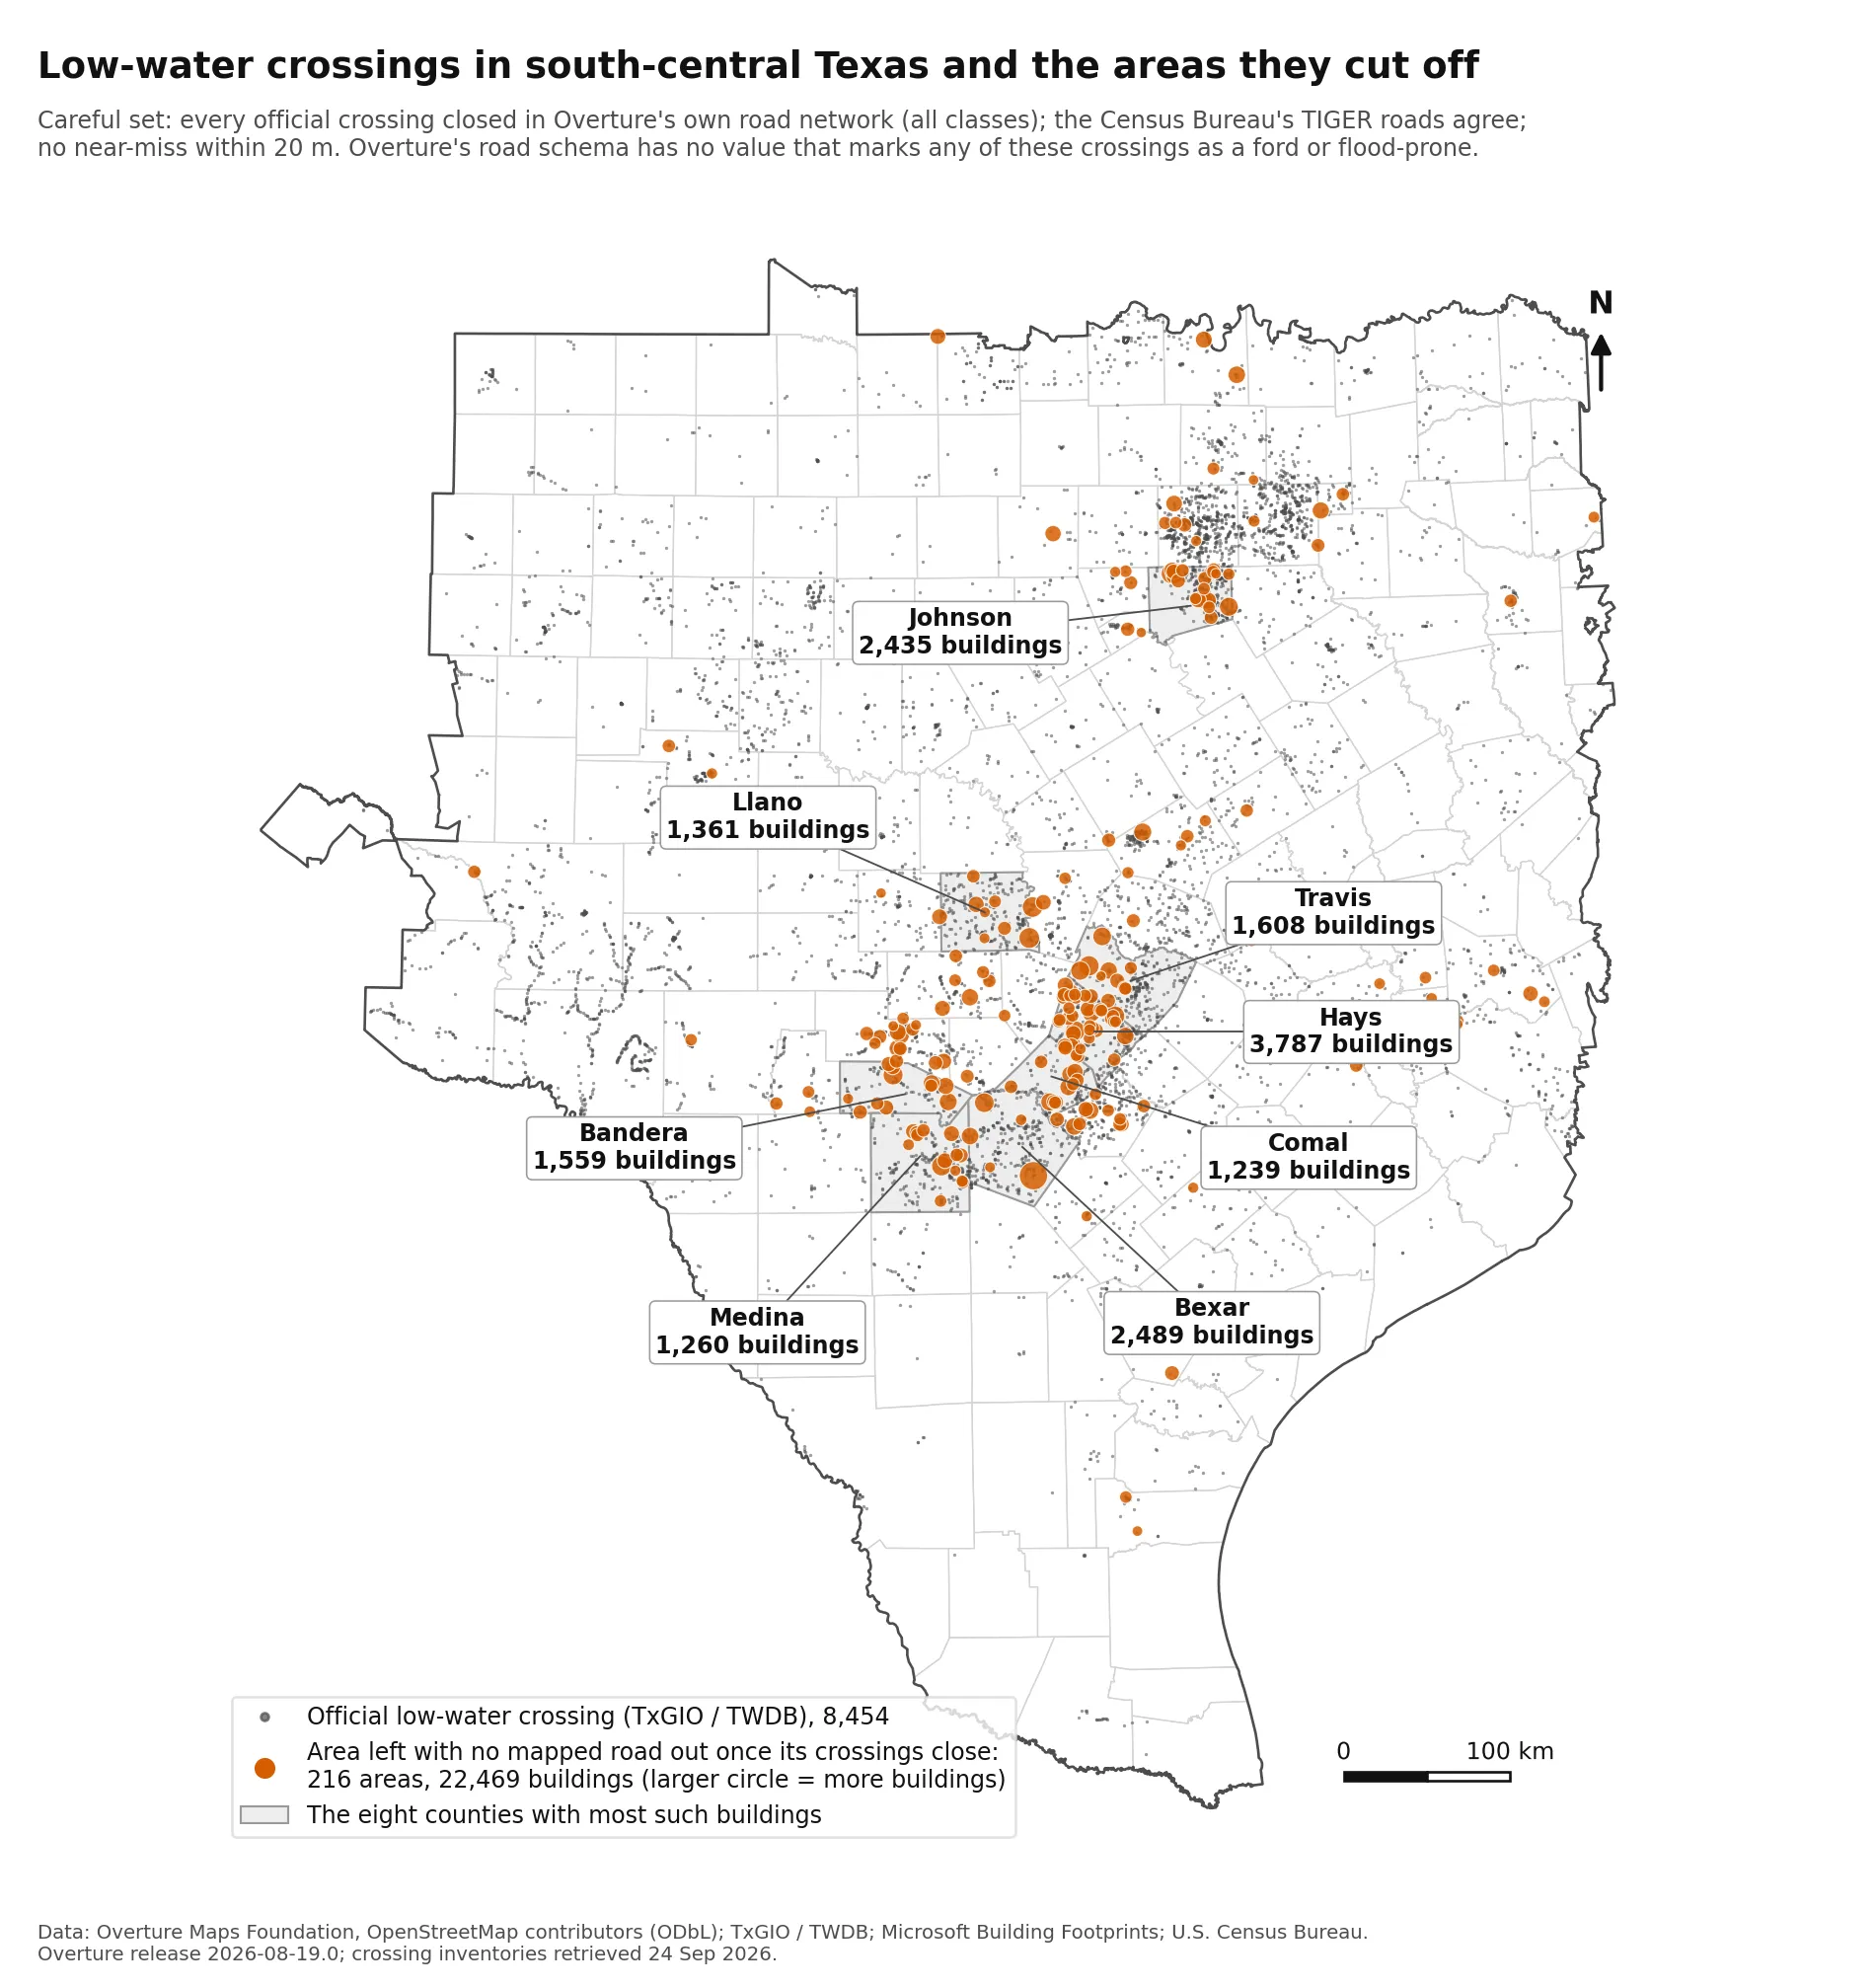
Part 2, the discovery. In the challenge’s Texas region there are 8,454 official low-water crossings: places where a road goes under water when it floods. Overture has the road at 93.1 percent of them and marks none as a crossing that floods, because its road schema has no value that could say so. A scorecard built on highway length cannot see that gap at all.
When I close the crossings in Overture’s own road network, 22,469 buildings (about 26,300 residents) in 216 areas are left with no mapped road out, and TIGER agrees. NOAA flood reports tie 20 deaths since 1996 to 16 named crossings. Two readings of a random sample on aerial imagery put 5,067 to 14,426 of those buildings behind no dry way out at all.
Part 1, the method. One script rebuilds the challenge’s coverage gap score exactly, from the organisers’ own data.
Technical detail
Part 1, the method. One script builds the coverage gap score for all 9,379 scored tracts from the organisers’ data, reproduces every count the data README publishes, and writes the scored file byte for byte. It scores a public error of 0.00000301 with the standard pyproj wheel, and exactly 0 with PROJ built for fused multiply-add. I then measured how far each of 29 alternative conventions and weightings moves the values and the scorecard’s ratios.
Design decisions
The build is pinned, deterministic, and stops rather than writing a wrong file.
Technical detail
- Inputs are pinned. Every challenge layer, the extra Overture road classes and the 90 NOAA files are checked against a sha256 manifest. When the organisers removed four layers from the bucket on 25 September 2026, both parts were rerun from local copies and came out byte for byte as before.
- No randomness in the scored column. No model, seed or manual step. The discovery’s random steps use fixed seeds, and the imagery audit’s two readings ship as files.
- It stops rather than writes a wrong file. Missing or changed inputs halt the run with the command that fixes it.
What it has found so far
The discovery above, the reproducible scored column, and the sensitivity tables, all in the repository with their licences.
Stack
Technical detail
Python 3.11 with geopandas, shapely, pyproj, pyarrow, pandas and DuckDB; OpenStreetMap, Overture Maps, TIGER/Line, NOAA Storm Events and Texas Water Development Board inventories.
Links
Want to talk about this work? Email me or download my CV.